“There are seven basic plots!” affirmed Christopher Booker.
“Seven?” echoed Ronald Tobias in amazement. “Seven? There are 20!”
Georges Polti sat watching the argument carry on, and he laughed. “You’re both mad. There are 36.”
Just how many truly unique plots do exist in stories, and why does it matter? It’s the question just about every writer has posed since the method of the storyteller was first probed by Aristotle over 2000 years ago.
All writers want to be creative, to be unique, and so the thought that they are simply retelling an old story in a new way can be deflating. However, tracking cultural evolution and the form tales have taken over the generations plays an integral part in not only understanding what makes a great story, but provides a complex, beautiful look into the machinations that drive how they work.
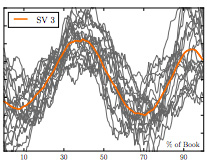
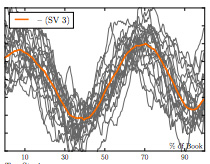
It’s for this reason that a team of mathematicians from Vermont, USA and Adelaide, Australia, decided to study the visual shapes that stories form by interpreting emotional arcs with the help of digital systems.
The research paper, which was published in late June 2016, was inspired by the master’s thesis of esteemed author Kurt Vonnegut. In his thesis – which Vonnegut considered his greatest contribution to Western culture – he charts the emotional ranges of Cinderella and the Old Testament, and comes to the conclusion that they are exactly identical.
The University of Chicago rejected his notion (“They can take a flying fuck at the moooooooooooooooon,” Vonnegut wrote in his autobiography, Palm Sunday), but he continued to present it as part of his lectures, as can be seen in the video below.
“There is no reason why the simple shapes of stories can’t be fed into computers,” he exclaimed, and now, finally, he has been proven right.
The team of researchers conducted their experiment in order to ascertain exactly how many core emotional arcs drive stories, and which result in the most successful outcomes.
To do so, they have used sentiment analysis to track the use of words that generally provoke a positive or negative reaction. These are then charted on a broad scale using a hedonometre, a psychological tool used to gauge happiness which has been employed since the late 1800s. You can see the results of the studies performed on each individual story (all 1700 of which were sourced from Project Gutenberg) here.
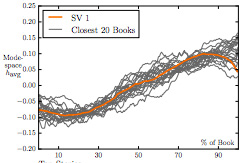
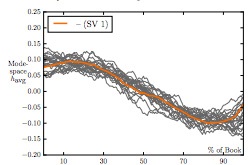
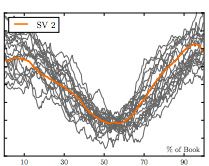
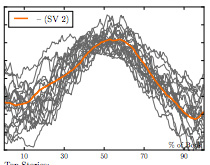
Rather than map each minor change occurring in each sentence or paragraph, a more general overview of story elements, or beats, is used to give each narrative a shape.
Unsurprisingly, the researchers discovered obvious trends.
Six trends, to be precise. The shapes are defined as follows:
Rags to Riches
a.k.a. ‘the rise’, the most popular story represented by this shape is Alice’s Adventures Underground, which would later become Alice in Wonderland. Alice starts at the bottom, quite literally, and works her way up, becoming more familiar with and happier in the land as she progresses.
Riches to Rags
a.k.a. ‘the fall’. Consider classic Victorian horror The House of the Vampire. As soon as the protagonist falls under the spell of the mysterious master, there is no escape.
Man in a Hole
a.k.a. ‘fall-rise’. The best example of this is Joseph Conrad’s novella, Typhoon. What starts out as a normal day on a steamer devolves into madness as the captain sails headfirst into a tropical storm. It’s worse than anybody on board could imagine, and the situation unravels quickly until the crew band together and a calm – however temporary – comes around.
Icarus
a.k.a. ‘rise-fall’, the protagonists work towards a release from their current, woeful situation, only to suffer for their hubris. These stories abound in the fables of Hans Christian Andersen.
Cinderella
a.k.a. ‘rise-fall-rise’, there’s no surprise as to what story this shape is named after. Cinderella meets the prince (rise), is forced to flee the ball and may never see him again (fall), but is saved when the silver slipper fits perfectly on her foot (rise).
Oedipus
a.k.a. ‘fall-rise-fall’. Oedipus faces a horrific situation. Just when things are getting worse, a solution appears to rear its head. Alas, it is an illusion, and the false hope only serves to send Oedipus to darker depths than before.
After establishing these shapes, the team then turned their attention to discovering which of these arcs proved most popular. Curiously, readers tended to be more interested in more ‘negative’ emotional arcs such as Icarus or Oedipus, or a Cinderella story that doesn’t have a happy ending, than any others.
It’s important information for writers. Not just because the information helps decode the enigma that is a great work in development, but also because it reveals where the opportunity for innovation, or a simple twist on expectation, can be found.
It certainly seems like the University of Chicago owe Vonnegut an apology.
To read the full report, click here.

